Though
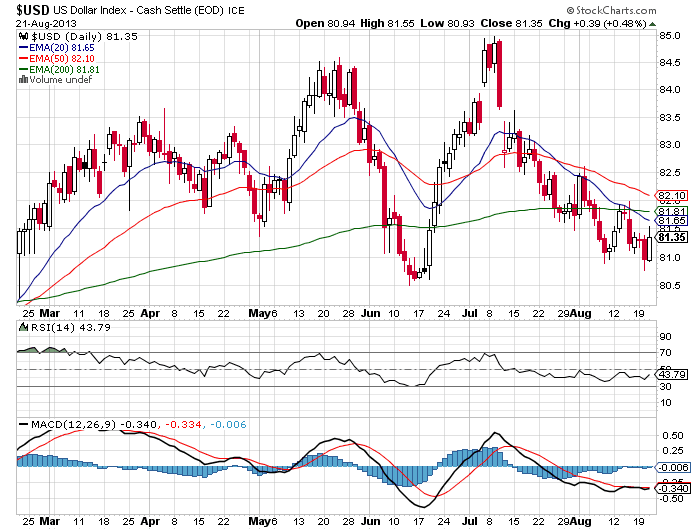
Dollar is creating havoc in INDIA…the Dollar Index which tracks Dollar against a basket of six
major currencies is lagging the Euro, the Swiss FRANC and the British POUND! As
you can see from the chart (Daily) above, that it is trading below its key
EMa’s where the 200 EMA at 81.81 has positioned itself over the price as a
resistance of sorts. The 50 EMA is also trending downwards. The price is still
making lower highs and lower lows!
Where
as on the weekly chart below we can see that the dollar is just a wee above its
200 EMA but trading under the 20 and the 50. Any break below the 200 at 80.52
will only lead to further weakness and will also put the Double TOP pattern
into play!